

Building products company Quanex (NYSE:NX) reported Q4 CY2024 results exceeding the market’s revenue expectations, with sales up 67.3% year on year to $400 million. The company expects the full year’s revenue to be around $1.85 billion, close to analysts’ estimates. Its non-GAAP profit of $0.19 per share was significantly above analysts’ consensus estimates.
Is now the time to buy Quanex? Find out by accessing our full research report, it’s free.
Quanex (NX) Q4 CY2024 Highlights:
- Revenue: $400 million vs analyst estimates of $382.6 million (67.3% year-on-year growth, 4.6% beat)
- Adjusted EPS: $0.19 vs analyst estimates of -$0.01 (significant beat)
- Adjusted EBITDA: $38.5 million vs analyst estimates of $31.62 million (9.6% margin, 21.7% beat)
- EBITDA guidance for the full year is $275 million at the midpoint, above analyst estimates of $272.3 million
- Operating Margin: -1.7%, down from 3.3% in the same quarter last year
- Free Cash Flow was -$24.13 million compared to -$5.73 million in the same quarter last year
- Market Capitalization: $954.6 million
George Wilson, Chairman, President and Chief Executive Officer, stated, “The first quarter of 2025 was a very busy time for Quanex internally and I would like to thank all my Quanex teammates for their continuous efforts as we navigate through the process of integrating legacy Quanex with legacy Tyman. The integration gained speed and traction during the quarter, and we remain confident in our ability to deliver on the $30 million cost synergy target. Volume came in as expected during the first quarter, and we were pleased with the margin expansion and the overall impact of the cost synergies we have realized to date. On a consolidated basis, results for the first quarter were again lifted by the contribution from the Tyman acquisition and we achieved margin expansion. Our continued focus on cash flow and managing working capital enabled us to repay approximately $12 million in debt during the first quarter of 2025, or approximately $65 million since closing the acquisition on August 1, 2024."
Company Overview
Starting in the seamless tube industry, Quanex (NYSE:NX) manufactures building products like window, door, kitchen, and bath cabinet components.
Home Construction Materials
Traditionally, home construction materials companies have built economic moats with expertise in specialized areas, brand recognition, and strong relationships with contractors. More recently, advances to address labor availability and job site productivity have spurred innovation that is driving incremental demand. However, these companies are at the whim of residential construction volumes, which tend to be cyclical and can be impacted heavily by economic factors such as interest rates. Additionally, the costs of raw materials can be driven by a myriad of worldwide factors and greatly influence the profitability of home construction materials companies.
Sales Growth
A company’s long-term sales performance can indicate its overall quality. Any business can put up a good quarter or two, but many enduring ones grow for years. Luckily, Quanex’s sales grew at a solid 10% compounded annual growth rate over the last five years. Its growth beat the average industrials company and shows its offerings resonate with customers.
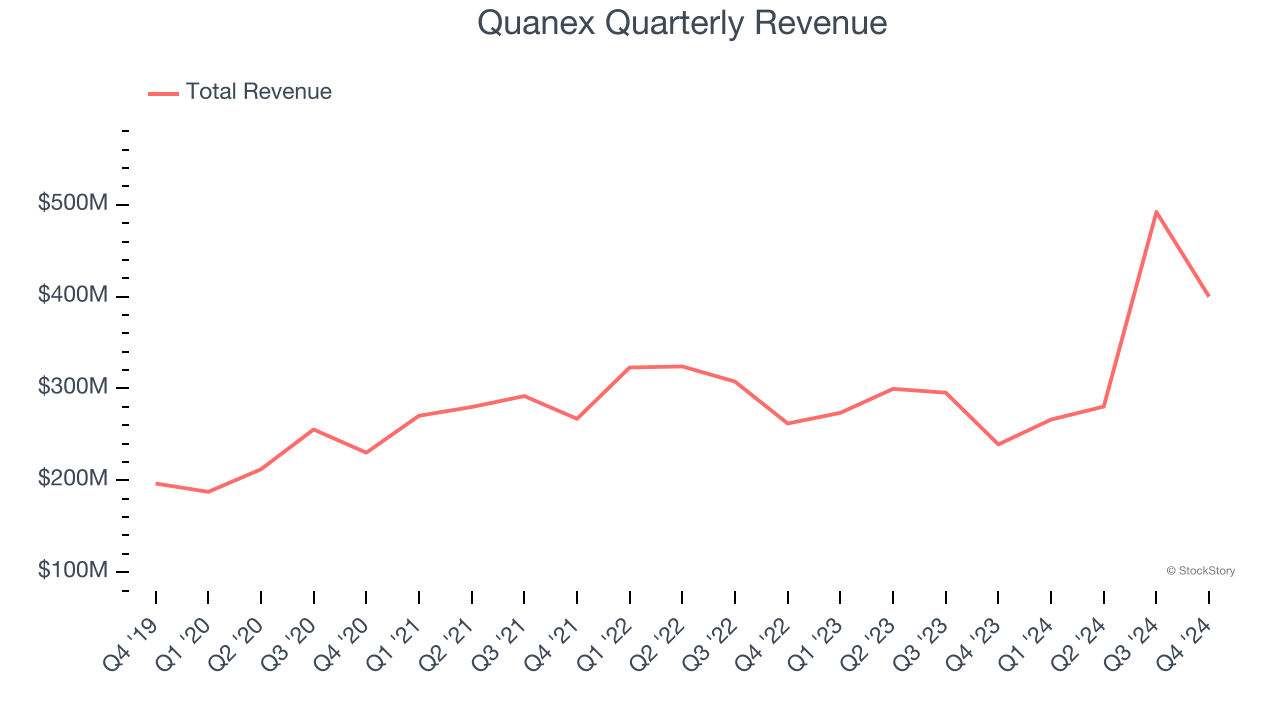
Long-term growth is the most important, but within industrials, a half-decade historical view may miss new industry trends or demand cycles. Quanex’s annualized revenue growth of 8.8% over the last two years is below its five-year trend, but we still think the results were respectable. 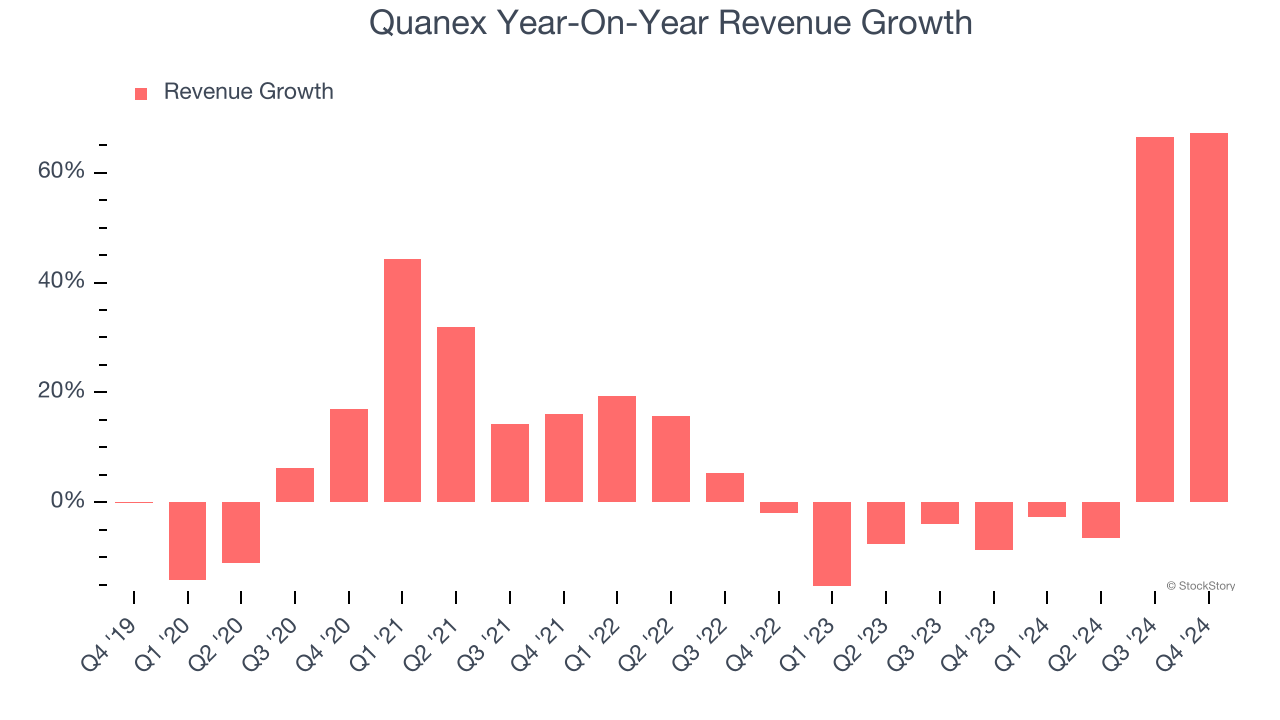
We can better understand the company’s revenue dynamics by analyzing its most important segments, Fenestration and Cabinet Components, which are 33.6% and 11% of revenue. Over the last two years, Quanex’s Fenestration revenue (window and door components, North America only) averaged 4.2% year-on-year declines while its Cabinet Components revenue (cabinet parts, North America only) averaged 12.9% declines.
This quarter, Quanex reported magnificent year-on-year revenue growth of 67.3%, and its $400 million of revenue beat Wall Street’s estimates by 4.6%.
Looking ahead, sell-side analysts expect revenue to grow 28.9% over the next 12 months, an improvement versus the last two years. This projection is eye-popping and indicates its newer products and services will fuel better top-line performance.
Here at StockStory, we certainly understand the potential of thematic investing. Diverse winners from Microsoft (MSFT) to Alphabet (GOOG), Coca-Cola (KO) to Monster Beverage (MNST) could all have been identified as promising growth stories with a megatrend driving the growth. So, in that spirit, we’ve identified a relatively under-the-radar profitable growth stock benefiting from the rise of AI, available to you FREE via this link.
Operating Margin
Operating margin is an important measure of profitability as it shows the portion of revenue left after accounting for all core expenses – everything from the cost of goods sold to advertising and wages. It’s also useful for comparing profitability across companies with different levels of debt and tax rates because it excludes interest and taxes.
Quanex was profitable over the last five years but held back by its large cost base. Its average operating margin of 7% was weak for an industrials business. This result isn’t too surprising given its low gross margin as a starting point.
Analyzing the trend in its profitability, Quanex’s operating margin decreased by 4.6 percentage points over the last five years. This raises questions about the company’s expense base because its revenue growth should have given it leverage on its fixed costs, resulting in better economies of scale and profitability. . Quanex’s performance was poor no matter how you look at it - it shows that costs were rising and it couldn’t pass them onto its customers.
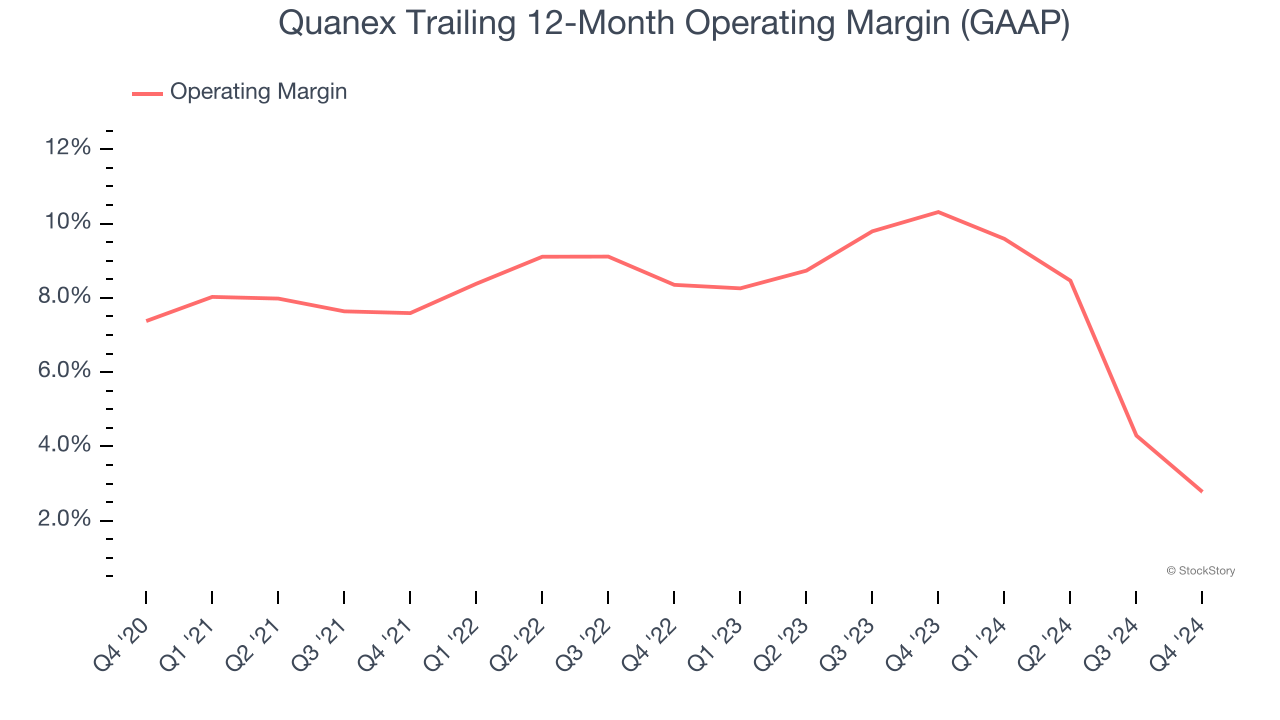
This quarter, Quanex generated an operating profit margin of negative 1.7%, down 5.1 percentage points year on year. Conversely, its revenue and gross margin actually rose, so we can assume it was recently less efficient because its operating expenses like marketing, R&D, and administrative overhead grew faster than its revenue.
Earnings Per Share
We track the long-term change in earnings per share (EPS) for the same reason as long-term revenue growth. Compared to revenue, however, EPS highlights whether a company’s growth is profitable.
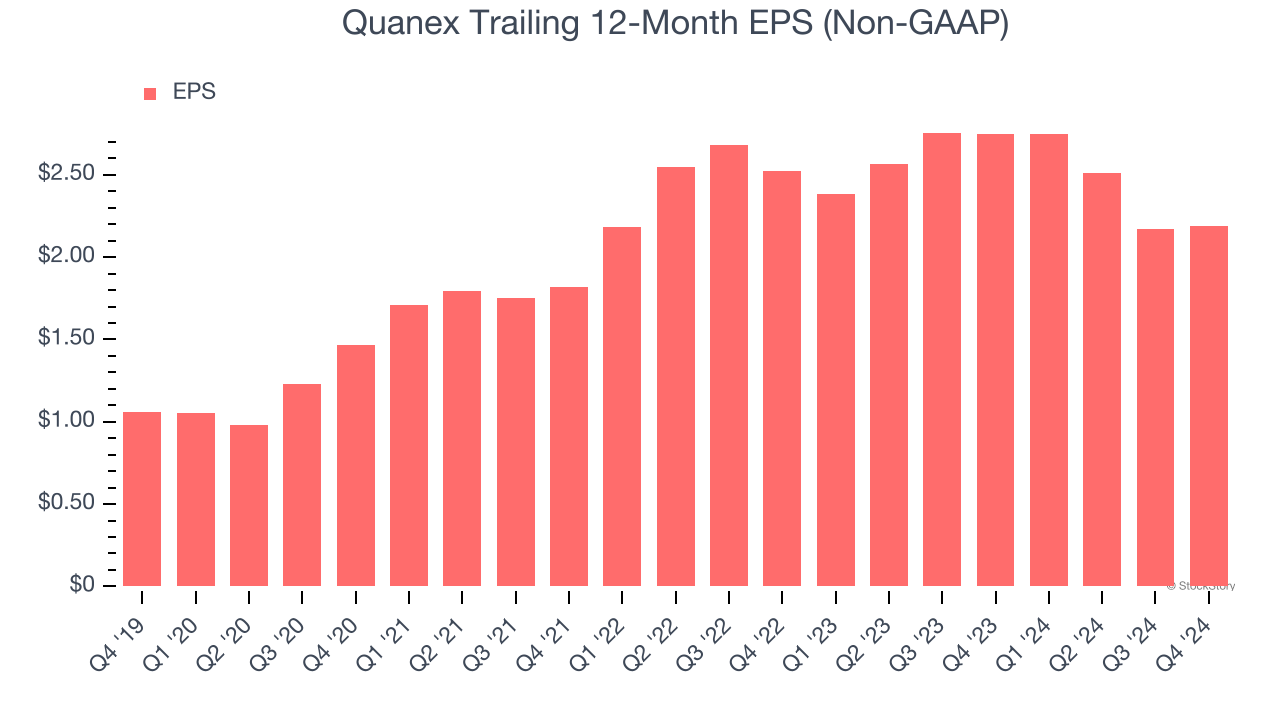
Quanex’s EPS grew at a spectacular 15.6% compounded annual growth rate over the last five years, higher than its 10% annualized revenue growth. However, we take this with a grain of salt because its operating margin didn’t expand and it didn’t repurchase its shares, meaning the delta came from reduced interest expenses or taxes.
Like with revenue, we analyze EPS over a more recent period because it can provide insight into an emerging theme or development for the business.
Quanex’s two-year annual EPS declines of 6.9% were bad and lower than its 8.8% two-year revenue growth.
In Q4, Quanex reported EPS at $0.19, up from $0.18 in the same quarter last year. This print easily cleared analysts’ estimates, and shareholders should be content with the results. Over the next 12 months, Wall Street expects Quanex’s full-year EPS of $2.19 to grow 17.4%.
Key Takeaways from Quanex’s Q4 Results
We were impressed by how significantly Quanex blew past analysts’ EPS and EBITDA expectations this quarter. We were also excited its revenue and full-year EBITDA guidance outperformed Wall Street’s estimates. Zooming out, we think this was a solid quarter. The stock traded up 3% to $21.05 immediately following the results.
Quanex put up rock-solid earnings, but one quarter doesn’t necessarily make the stock a buy. Let’s see if this is a good investment. The latest quarter does matter, but not nearly as much as longer-term fundamentals and valuation, when deciding if the stock is a buy. We cover that in our actionable full research report which you can read here, it’s free.