

Industrial equipment and engineered products manufacturer Albany (NYSE:AIN) announced better-than-expected revenue in Q2 CY2025, but sales fell by 6.2% year on year to $311.4 million. The company expects the full year’s revenue to be around $1.22 billion, close to analysts’ estimates. Its non-GAAP profit of $0.57 per share was 22.4% below analysts’ consensus estimates.
Is now the time to buy Albany? Find out by accessing our full research report, it’s free.
Albany (AIN) Q2 CY2025 Highlights:
- Revenue: $311.4 million vs analyst estimates of $303.6 million (6.2% year-on-year decline, 2.6% beat)
- Adjusted EPS: $0.57 vs analyst expectations of $0.73 (22.4% miss)
- Adjusted EBITDA: $51.88 million vs analyst estimates of $60 million (16.7% margin, 13.5% miss)
- The company reconfirmed its revenue guidance for the full year of $1.22 billion at the midpoint
- Management reiterated its full-year Adjusted EPS guidance of $3.20 at the midpoint
- EBITDA guidance for the full year is $250 million at the midpoint, above analyst estimates of $247.8 million
- Operating Margin: 7.2%, down from 12.9% in the same quarter last year
- Free Cash Flow Margin: 6%, down from 19.2% in the same quarter last year
- Market Capitalization: $2.16 billion
"Overall, I am encouraged with our progress this year. Our business segment leaders are performing well as they restructure, invest and strengthen their operations. Our second quarter financial results lagged our expectations, but the performance was largely impacted by certain timing and operational issues and we are confident in our recovery," said President and CEO, Gunnar Kleveland.
Company Overview
Founded in 1895, Albany (NYSE:AIN) is a global textiles and materials processing company, specializing in machine clothing for paper mills and engineered composite structures for aerospace and other industries.
Revenue Growth
Examining a company’s long-term performance can provide clues about its quality. Any business can put up a good quarter or two, but the best consistently grow over the long haul. Regrettably, Albany’s sales grew at a sluggish 3.7% compounded annual growth rate over the last five years. This was below our standard for the industrials sector and is a rough starting point for our analysis.
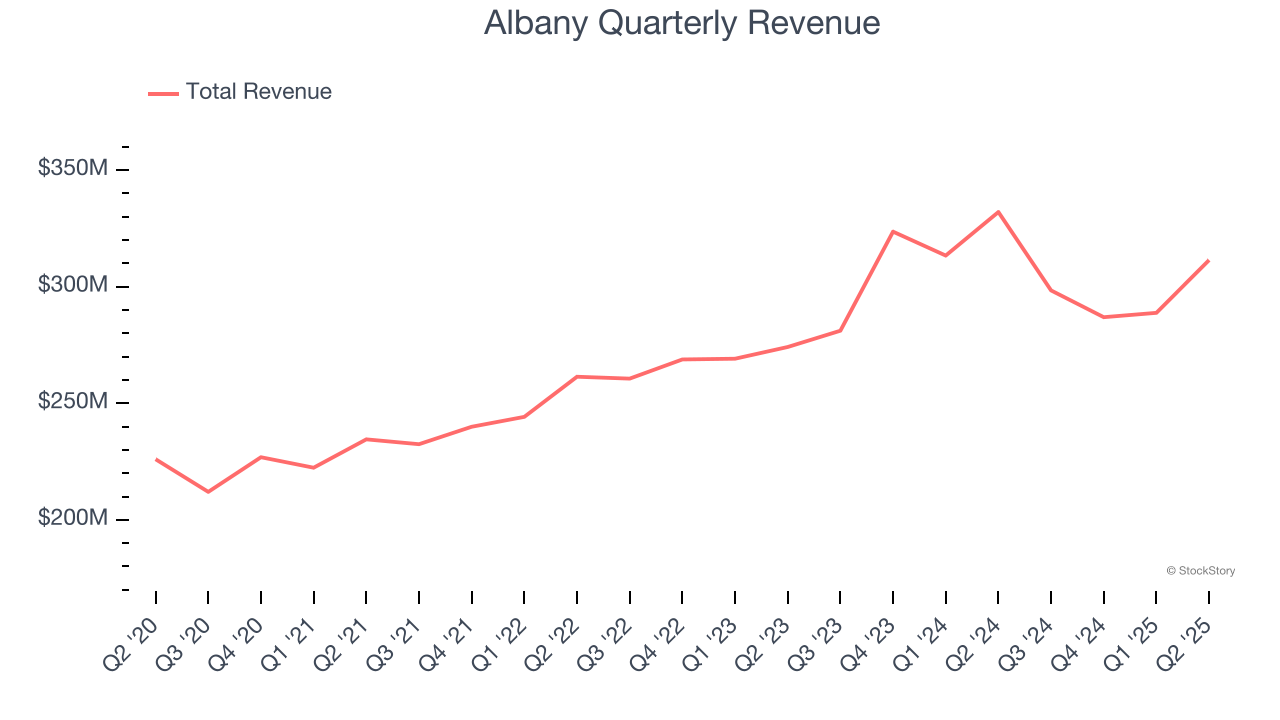
Long-term growth is the most important, but within industrials, a half-decade historical view may miss new industry trends or demand cycles. Albany’s annualized revenue growth of 5.1% over the last two years is above its five-year trend, but we were still disappointed by the results. 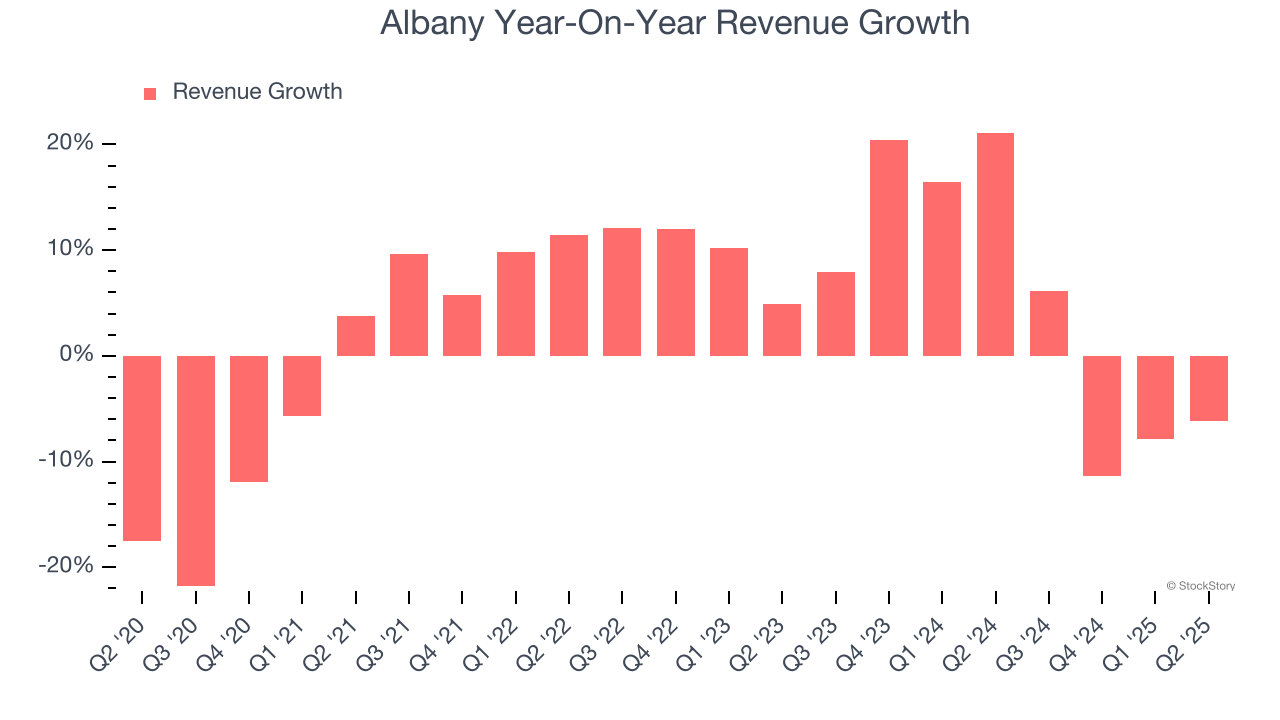
We can dig further into the company’s revenue dynamics by analyzing its most important segments, Machine Clothing and Engineered Composites, which are 58.1% and 41.9% of revenue. Over the last two years, Albany’s Machine Clothing revenue (paper manufacturing belts) averaged 9.3% year-on-year growth while its Engineered Composites revenue (aerospace components) averaged 1% growth.
This quarter, Albany’s revenue fell by 6.2% year on year to $311.4 million but beat Wall Street’s estimates by 2.6%.
Looking ahead, sell-side analysts expect revenue to grow 4% over the next 12 months, similar to its two-year rate. This projection doesn't excite us and suggests its products and services will see some demand headwinds.
Unless you’ve been living under a rock, it should be obvious by now that generative AI is going to have a huge impact on how large corporations do business. While Nvidia and AMD are trading close to all-time highs, we prefer a lesser-known (but still profitable) stock benefiting from the rise of AI. Click here to access our free report one of our favorites growth stories.
Operating Margin
Operating margin is a key measure of profitability. Think of it as net income - the bottom line - excluding the impact of taxes and interest on debt, which are less connected to business fundamentals.
Albany has been an efficient company over the last five years. It was one of the more profitable businesses in the industrials sector, boasting an average operating margin of 14.5%. This result isn’t surprising as its high gross margin gives it a favorable starting point.
Looking at the trend in its profitability, Albany’s operating margin decreased by 10 percentage points over the last five years. This raises questions about the company’s expense base because its revenue growth should have given it leverage on its fixed costs, resulting in better economies of scale and profitability.
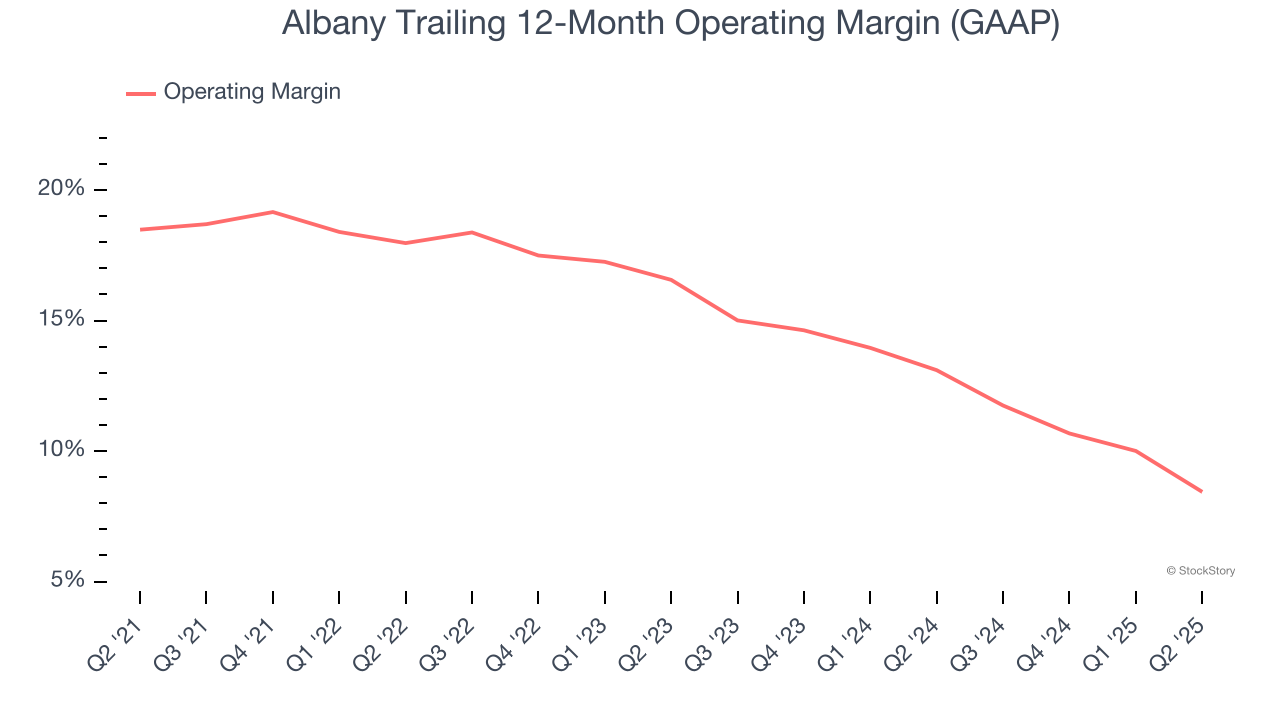
This quarter, Albany generated an operating margin profit margin of 7.2%, down 5.8 percentage points year on year. Since Albany’s operating margin decreased more than its gross margin, we can assume it was less efficient because expenses such as marketing, R&D, and administrative overhead increased.
Earnings Per Share
We track the long-term change in earnings per share (EPS) for the same reason as long-term revenue growth. Compared to revenue, however, EPS highlights whether a company’s growth is profitable.
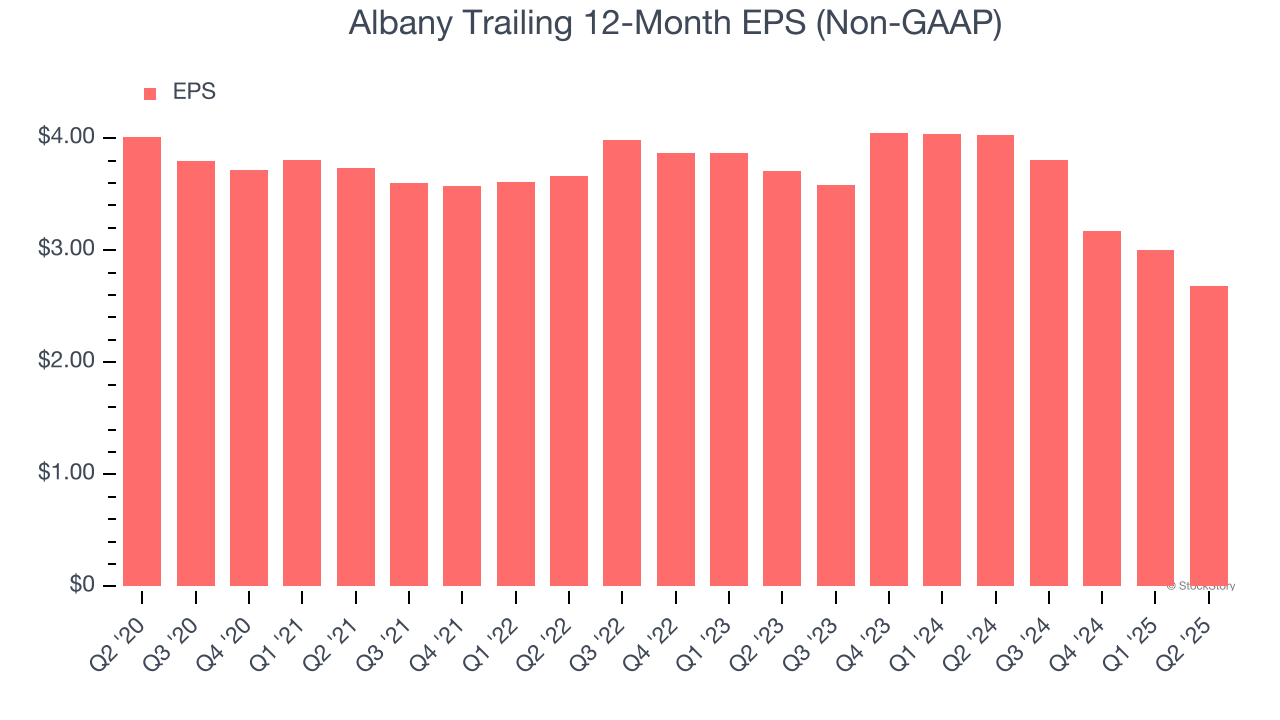
Sadly for Albany, its EPS declined by 7.7% annually over the last five years while its revenue grew by 3.7%. This tells us the company became less profitable on a per-share basis as it expanded due to non-fundamental factors such as interest expenses and taxes.
Diving into the nuances of Albany’s earnings can give us a better understanding of its performance. As we mentioned earlier, Albany’s operating margin declined by 10 percentage points over the last five years. This was the most relevant factor (aside from the revenue impact) behind its lower earnings; interest expenses and taxes can also affect EPS but don’t tell us as much about a company’s fundamentals.
Like with revenue, we analyze EPS over a more recent period because it can provide insight into an emerging theme or development for the business.
For Albany, its two-year annual EPS declines of 15% show it’s continued to underperform. These results were bad no matter how you slice the data.
In Q2, Albany reported adjusted EPS at $0.57, down from $0.89 in the same quarter last year. This print missed analysts’ estimates. We also like to analyze expected EPS growth based on Wall Street analysts’ consensus projections, but there is insufficient data.
Key Takeaways from Albany’s Q2 Results
We enjoyed seeing Albany beat analysts’ revenue expectations this quarter. We were also glad its full-year EBITDA guidance slightly exceeded Wall Street’s estimates. On the other hand, its EBITDA missed and its EPS fell short of Wall Street’s estimates. Overall, this quarter could have been better. The stock traded down 3.1% to $68.83 immediately after reporting.
Albany’s earnings report left more to be desired. Let’s look forward to see if this quarter has created an opportunity to buy the stock. The latest quarter does matter, but not nearly as much as longer-term fundamentals and valuation, when deciding if the stock is a buy. We cover that in our actionable full research report which you can read here, it’s free.